Part 1 - How Calgary Police leadership cheated the census


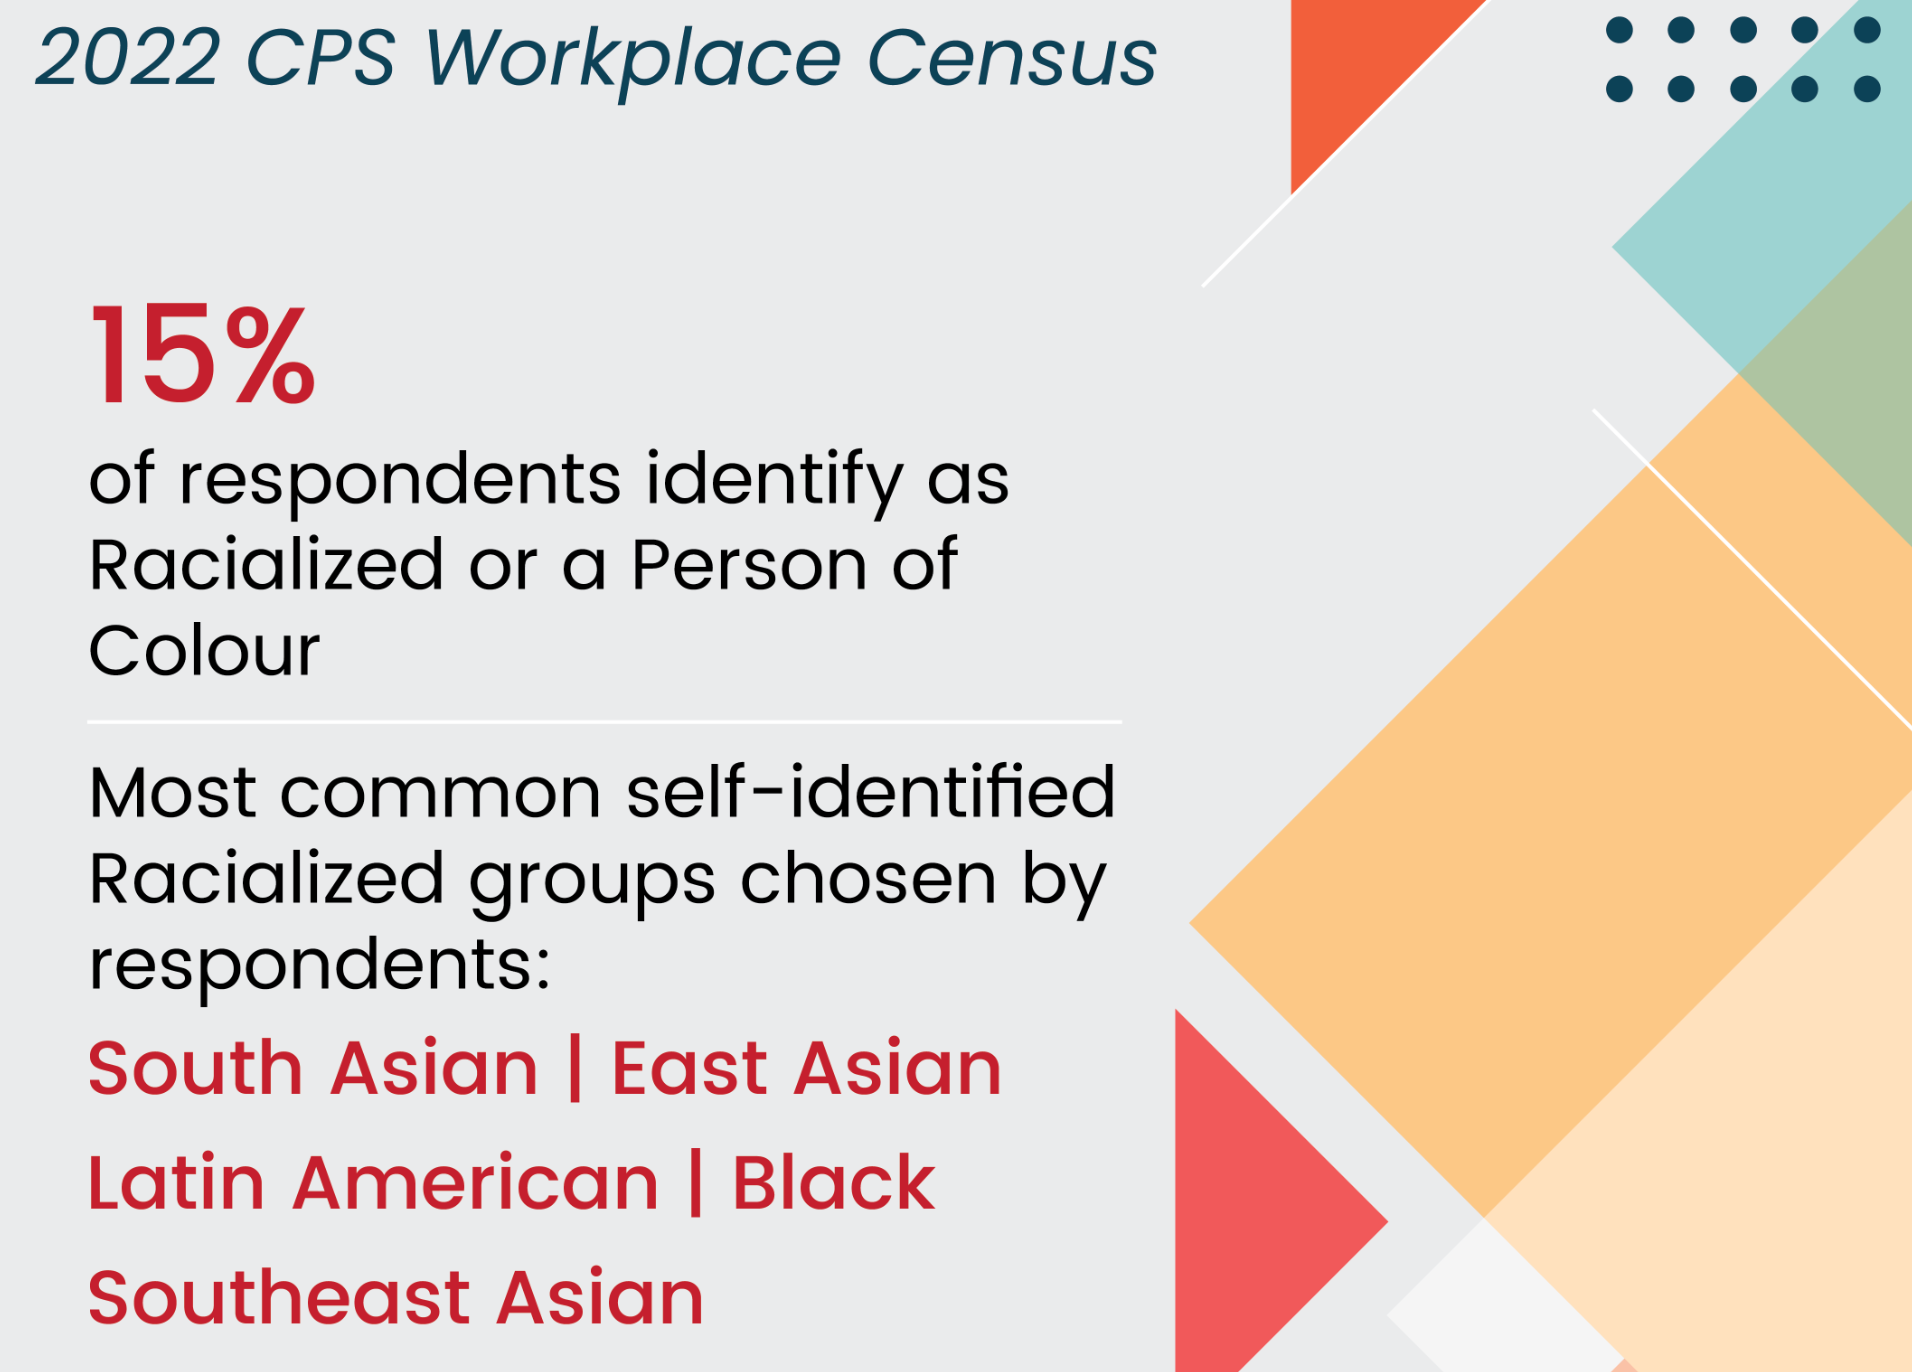
Drug Data Decoded has obtained Leger's raw data from the 2022 Calgary Police Workplace Census.
Despite a seeming attempt to shield them from public scrutiny, statistics from the Office of the Chief were deciphered and reveal a leadership team at odds with its uniformed officers and the city they serve.
In 2017, Mount Royal criminologist Kelly Sundberg offered an apparent apology after the Calgary Police Workplace Census showed that men occupy 75% of the force's supervisory roles:
“The seventh principle of policing is the police are the public and the public are the police . . . the police should represent a good cross-section of the communities that they police... They’re not there yet, but I would suggest that really meaningful and concerted efforts are being made to get us there for Calgary.”
Professor Sundberg appears to have miscalculated, as the 2022 census shows that men now occupy 81.5% of supervisory roles among sworn police officers. When accounting for civilian staff, the proportion of men in supervisory positions is 69%. (The count of gender-non-binary individuals was below the threshold to reveal responses, but the data show that zero of 20 non-binary respondents among sworn officers occupy supervisory positions. The broader ratio among sworn officers suggests there should be 4 non-binary respondents in supervisory positions.)
Although every local news outlet chose not to report on the 2022 Calgary Police Workplace Census, the first since 2017, Drug Data Decoded obtained the raw data through a freedom of information request.
Part 1 of this 3-part series will examine how the census appears to have been manipulated to hide the data for the Office of the Chief.
Part 2 will inspect deciphered data from the Office of the Chief, comparing these with responses from the four other Calgary Police bureaus.
Part 3 will compare the census data with the claims made by Calgary Police through an unchallenged campaign centred on its census report.
Sworn Officer and Civilian Staff response spreadsheets obtained through the freedom of information request will be made available in Part 2.
Chief Neufeld: "we don't just serve the community, we reflect it, and we are a part of it."
As polling company Leger asserts in the 2022 Workplace Census report, "once 40% of a population responds to a survey or provides input then those results can be generalized to the entire population with confidence." Since the Calgary Police response rate was 54%, we can be confident that patterns in the data are broadly representative, with the caveat that response rates were not provided for the five bureaus shown in the data.
Responses from the Office of the Chief are of critical interest to understand who is making decisions that affect officers and the public at large. However, at an unknown stage in data processing, it appears that one of 30 responses from the Office of the Chief were removed from the total response tallies but not from the category responses. This left an impression that only 29 total responses were provided in the spreadsheets – one response shy of the threshold needed to reveal the data. (Drug Data Decoded is awaiting earlier drafts of these documents through a follow-up inquiry.)
Nonetheless, by subtracting the sum of responses for all other bureaus from the total responses for any given question, the responses from the Office of the Chief are easily extracted.
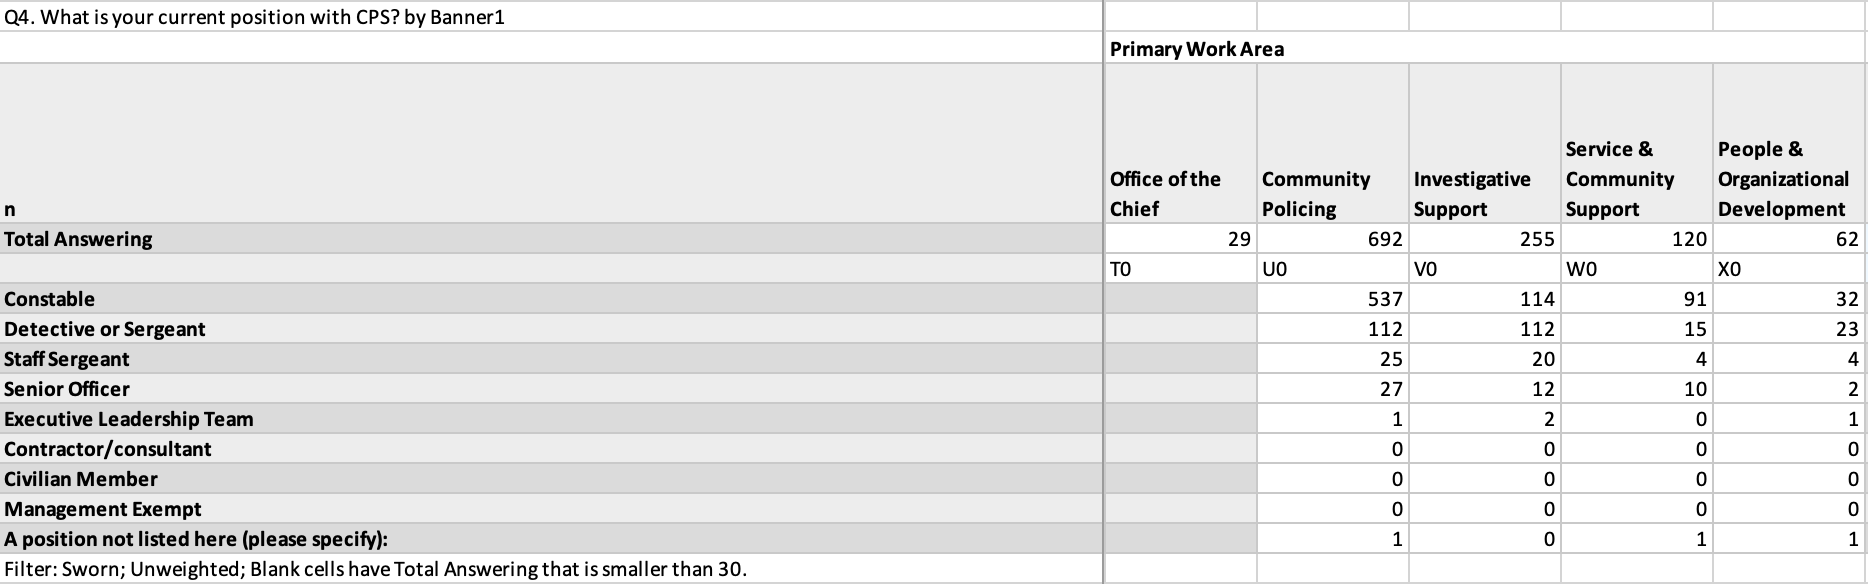
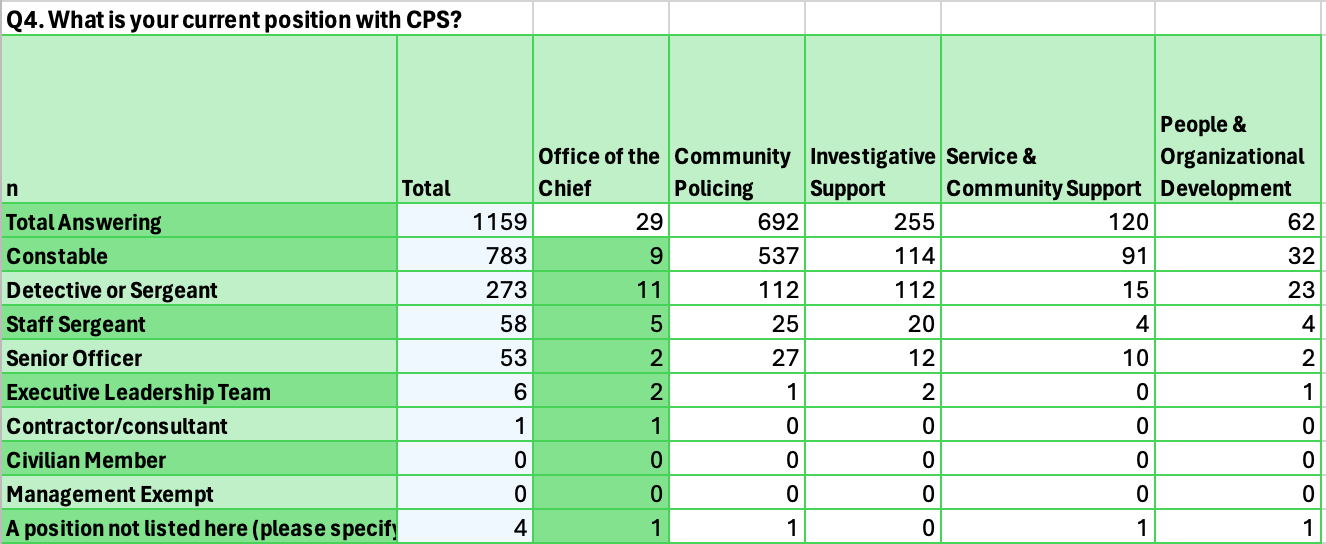
Many of the response categories sum up to 30 total responses, despite "29" being listed as Total Answering. Because the threshold for revealing the responses is 30 for any given group, the removal of one response from Total Answering may provide cover for the Office of the Chief to hide its data. This is true of several questions for which the responses are discrete numbers.
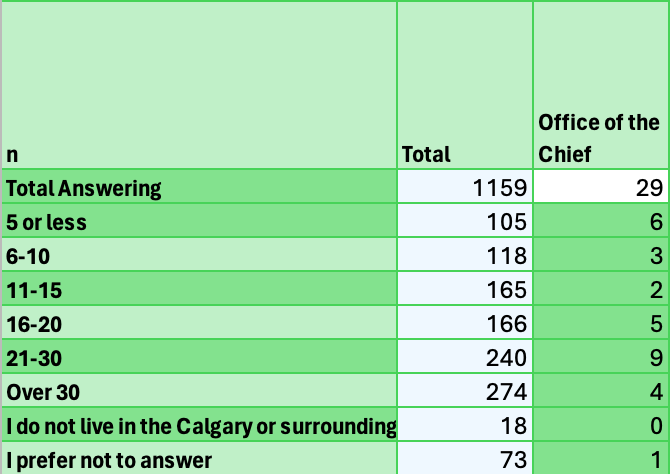
For example, If you live in the Calgary or surrounding areas, how long have you lived there? asks respondents for a discrete number. In this question, the total respondents from the Office of the Chief add up to 30 (6+3+2+5+9+4+1), while the Total Answering line still shows 29. This pattern was reproduced across similar questions.
If earlier drafts of these documents reveal tampering with response data to protect the Office of the Chief, it suggests a disturbing lack of transparency that fits a broader pattern baked into policing in Alberta that was painstakingly detailed in the film No Visible Trauma.
National relevance
Other cities should take note. In October 2020, Toronto Police Chief James Ramer made the following commitment to the Toronto Police Board in a document titled Preliminary Report Diversity in Human Resources:
"Our commitment to the Board is that the Service will create the foundation for an online census to help refine, implement, and further evaluate the outcomes of our programs against our commitment towards a more diverse and equitable organization."
Over three years later, no census is forthcoming from Toronto Police Service.
In 2012, Windsor Police Service launched a census with an explicit aim to "Enhance perceptions of being progressive leaders committed to diversity and inclusion, and being representative of our community." The service's most recent census appears to have been conducted in 2018, and revealed 83.7% white membership with no other racial identity exceeding 3.3%, despite Asian ethnicities making up 23% of the city's population in 2016.
Peel Regional Police, which polices a population that is 64.5% racialized according to a prominent graph on Page 1 of its report, buried its racial data on page 8 of its report, focusing first on new hires, applicants and promotions. In total, racialized employees in uniform made up 29.5% of the force in the 2021 census.

No census data were found for police forces in Vancouver, Edmonton, Winnipeg, Montreal, or Halifax, though some racial data is included in annual reports by some departments.
When police services conduct their own workplace census, media should treat these primarily as propaganda exercises to smooth out mismatches between data and the "progressive" perception these services are keen to convey to the public. The visual techniques are readily visible on the front pages of existing reports.
Rather than reprinting police talking points, journalists should be prepared to obtain and analyze the raw census data to support the public in seeing through the spin.
Drug Data Decoded provides analysis on topics concerning the war on drugs using news sources, publicly available data sets and freedom of information submissions, from which the author draws reasonable opinions. The author is not a journalist.